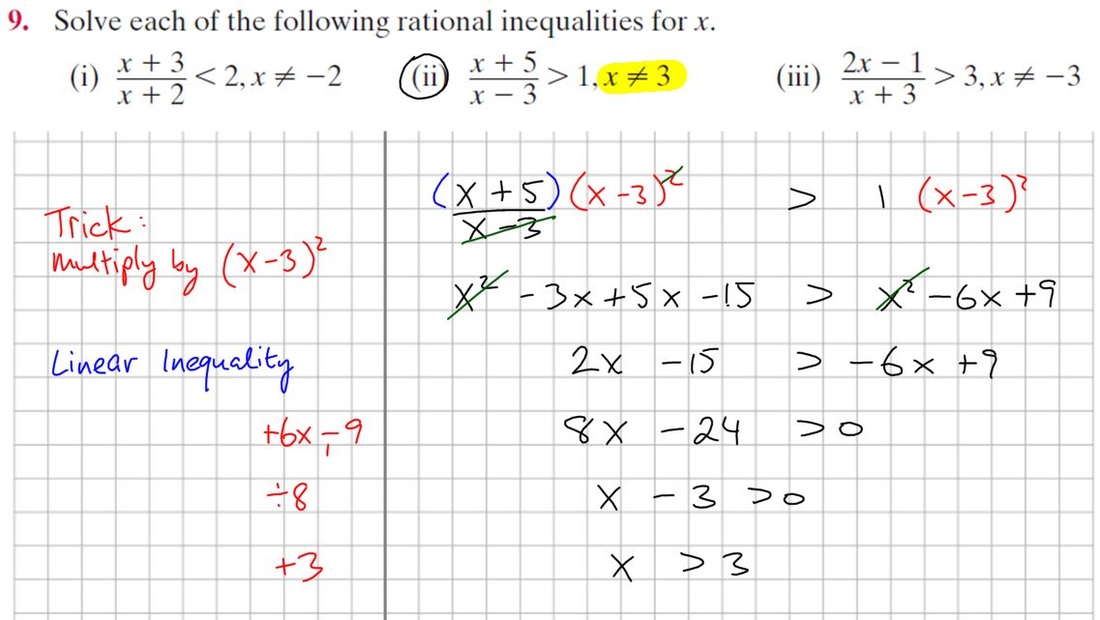
Continued with 9.2 looking at ration inequalities.
HW: Look at Video examples in 9.3 and answer questions from Ex.9.3
HW: Look at Video examples in 9.3 and answer questions from Ex.9.3
| | | |
|
|
|
Continued with 9.2 looking at ration inequalities. HW: Look at Video examples in 9.3 and answer questions from Ex.9.3
4 Comments
confused
2/12/2015 08:20:27 am
sir i cannot grasp how you are getting the points to plot on the graph. yes i understand you sub in instead of x , you sub a number in and i understand the first one is always zero but after that im lost.
Mr R
2/12/2015 08:46:51 am
To graph a line you need to know any two points. If you have an equation of the line you use it to get get points. You do this by either subbing in an x value to get a corresponding y values; or sub in a y value to get the corresponding x value. You can sub in any number you wish. It is usually easiest to sub in 0 for x and get the point where the line crosses the y axis, and then 0 for y and find where it crosses the x axis.
Student
2/12/2015 10:14:51 am
Any khan academy links for these I'm still struggling after using the book and these videos?
Mr R
2/22/2015 11:05:12 am
The Khan Academy Videos in this area are poor quality. Try this video https://www.youtube.com/watch?v=BXWzNp-4ilA Leave a Reply. |
Archives
June 2015
AuthorMr Roche Categories |
 RSS Feed
